Help
Network Module
What is a Network?
Don't have a Network?
Already have a Network?
Display Metrics Results
Display Statistical Charts
Display Play Ending Results
Network Module
What is a Network?
Networks represent interactions/connections between different subjects/objects. They can be used to model a wide range of situations including, but not limited to, team sports, information systems, social networks. The uPATO allows you to create and analyze networks in a simple way.Create a Network
To start creating a network go to Modules > Create Network. Here you can choose between 3 categories: Sports, General or Import File. The Sports and General options allow for the creation of a Network in an interactive way, while the Import File creates a Network from an external file containing the nodes' interactions.(Sports) - Field: This option can be used to choose a field for the desired sport. The selected field will be placed in the background, which helps in the visualization of the team's formation.
(Sports) - Team Size: There are two sliders, one for each team's size. The second slider can be ignored when configuring only one team.
(Sports) - Player Style: This option is used to choose the player's representation: either a Sports Shirt or a Square.
(Sports) - Direction matters: This checkbox is to choose if the direction in the interaction between two nodes should be considered (digraph) or not (graph) in the Network creation. If not selected then it is only considered an interaction between two nodes. If selected then it is considered both the interaction and the direction.
(Sports) - Register play endings: This checkbox is to choose if play endings are to be considered while creating the Network to later display more statistics and results about them. A play ending is when the team with the ball possession looses it and the system allows the user to register it.
(General) - Number of Nodes: Same as Sports Team Size, this slider is to choose the number of nodes present in the Network.
(General) - Type of graph: Same as Sports Direction matters, this option is to choose the type of graph. A Directed graph will consider both the interaction and direction between two nodes. An Undirected graph will only consider the interaction between the two nodes.
After all options choosen click on Create Network button to start the Network creation. This new window is divided in 3 main areas that can be visualized on the following image:
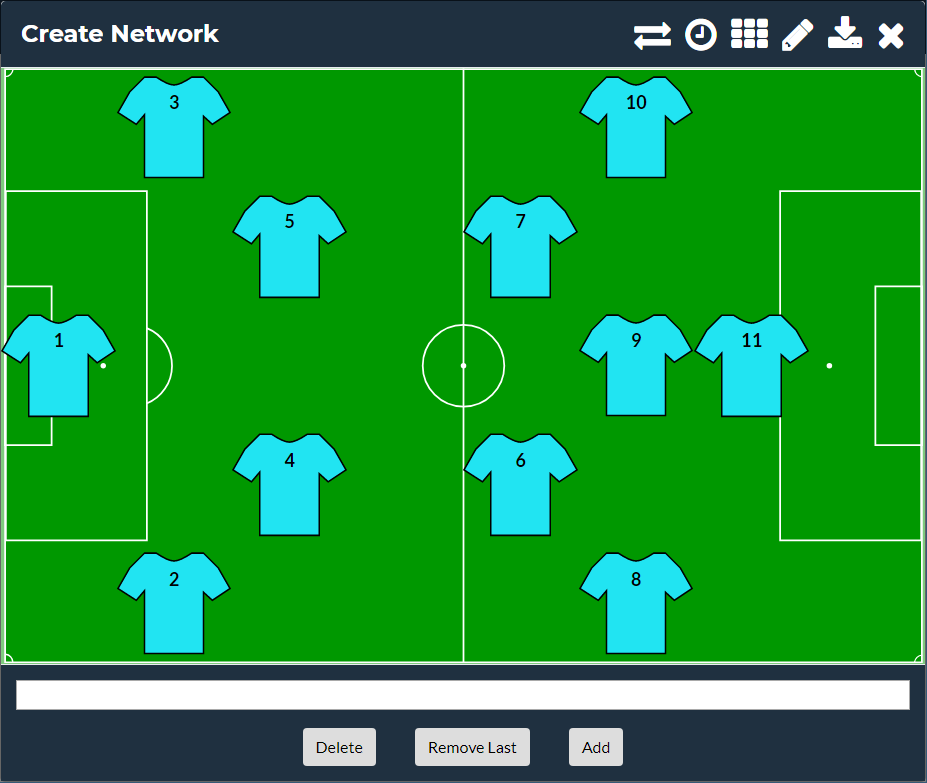
Top area: This area consits of 6 buttons:
() to switch between both teams. Can be ignored if only one team is being used.
() to simulate a second half and mirror the teams formations.
() to change the players positions on the field and set the desired formation.
() to edit the players names and numbers.
() to create save states for the Network.
() to close the window.
Middle area: This is the biggest area and represents the field and Network nodes (Players in case of Sports) the user can interact with to create the Network. To record an interaction between two nodes the user only needs to click/touch on the first node and then on the second node. To add new interactions to the same or other nodes just keep clicking/touching on them by the desired order and the interaction chain link will be shown on the bottom area of the screen, explained below.
Bottom area: This area consists in 4 elements: A large horizontal bar that shows the interactions chain link created by the user (explained in the middle area above) and 3 buttons. The [ Add ] button takes the current interactions and adds them to the Network. The other two buttons are used in case the user has made a mistake and wishes to clear/modify the interactions. The [ Remove Last ] button removes the last node from the interactions chain link and the [ Delete ] button removes the entire interactions chain link. Important note: after the current interactions were added to the Network it wont be possible to change/delete them.
If (Sports) - Register play endings checkbox is selected and the user adds the current play to the Network using the [ Add ] or () buttons, the system will ask how the current team play ended by showing the possible options on a circular menu that can be visualized on the following image (this is just an example):
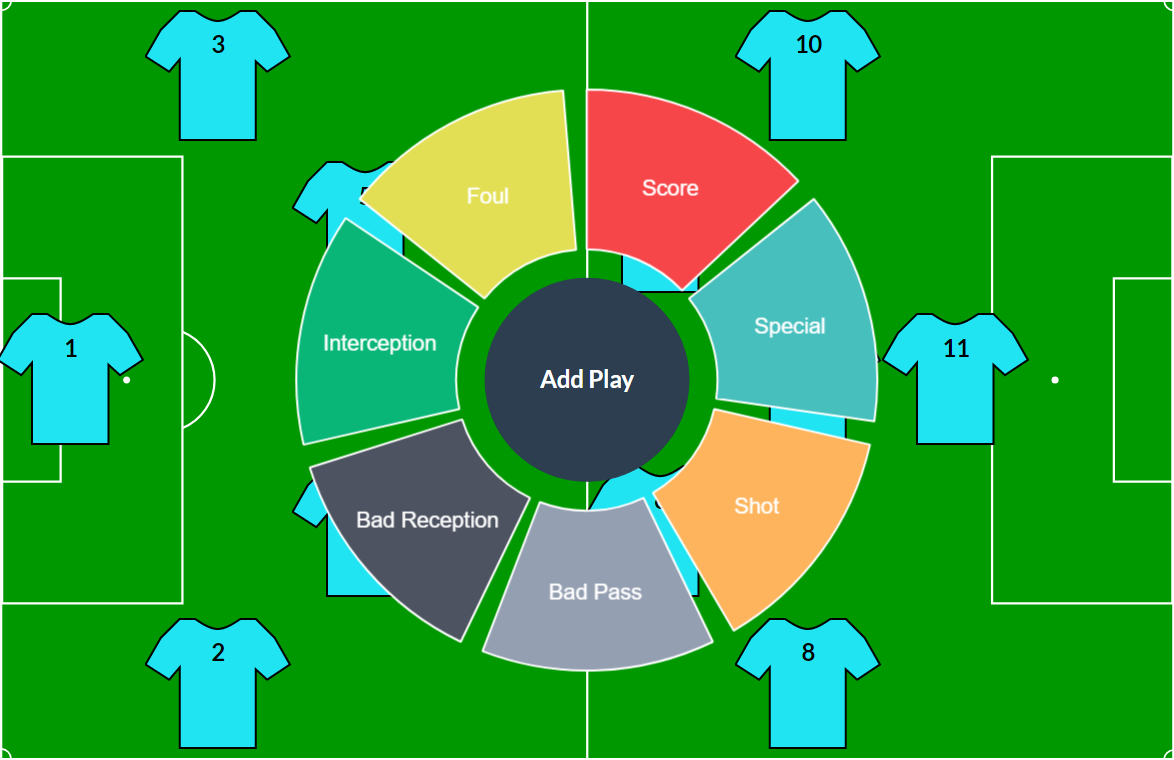
Play Ending Options:
Score to record a score goal.
Special to record a special play ending defined by the user.
Shot to record a player shot.
Bad Pass to record a bad pass from a player.
Bad Reception to record a bad reception from a player.
Interception to record an interception from the other team.
Foul to record a foul.
The system will also record the player or team involved in the play ending. In case of Score, Special, Shot, Bad Pass and Bad Reception the player recorded will be the last player (node) selected by the user on the interactions chain link. In the other two cases the system will just record the opposite team that made the Interception or Foul. Also in the case of Score and Special the system will create specific Networks for each of this play endings to help identifying the most important players on all Scores and Special plays. All this records will be saved and later generate statistical charts to help study the match, teams and players.
File: this is the file with the nodes interactions. The format of this file should be as following:
1;2;5;1;3;4
4;2;1;5;4;1;2;3;4
1;2;5;3;2;4;5;1
4;3
1;2;3;4;3;4;5
Two numbers (nodes) separated by a semicolon represent an interaction between them. The numbers must be in the range of 1 to n being n the amount of nodes in the Network.
Number of nodes: this is the total number of nodes the Network will have.
Direction matters: if selected it will be considered both the interaction and direction between two nodes. If not selected then only the interaction between the two nodes will be considered.
File Name: An optional file name for the Network file that will be downloaded.
Save a Network
To save the current Network go to the Network creation window, explained on Help > Create Network (Sports/General), and click on the button. In this window you can save different states of the Network while you create it. To create a state click on the button. You can also type a state name to help identify it. The first state is the global state and it saves the entire Network (from the beggining to the end). All the other states are your custom saved states. Each time you save a state the partial Network is reseted. Each state has three buttons at the end. The first two are a quick shortcut to display the graph/digraph representation of the network from each team. The third one is to download that saved state of the network. If you want to download the entire network go for the first state named: 0 - Global.Display a Network
To show a graph or digraph representation of a Network go to Modules > Display Network. Here you can upload a Network file either created and downloaded from Create Network or from an external source. If uploaded a file from an external source then it is important to know that the file should be formatted like the following example (i.e., a square matrix):0 0 4 7 0 2 1 0 3 3 0 1 3 4 0 10 1 2 2 6 5 0 4 6 0 0 4 5 0 5 0 3 0 4 4 0
It must have the same amount of rows and columns (square matrix) and each one represent a node from the Network. The values can be read in two ways: horizontally, the number of interactions from one node (row) to all the other nodes (columns) or vertically, the number of interactions one node (column) receives from all the other nodes (rows). Example in case of Sports: if the third row represents the Player 3 of the Network and the fourth column represents the Player 4 then the value 10 (row: 3, column: 4) can represent the amount of passes that Player 3 made to Player 4 (read horizontally) or that Player 4 received from Player 3 (read vertically).
After having the Network file it can be uploaded using the Browse button and selecting its local path. A table representation of the file can be visualized to make sure its well formatted like explained above and an optional second Browse button appears to upload a configuration file. This file is automatically created when the Network is downloaded from Create Network and it contains (for Sports) the players names and/or numbers as well as the team formation to display the nodes of the graph/digraph with the proper custom labels and formation. The last option is to choose any Sports Field (or none) that will be used as background where the network will be represented. After all set either click Clear Network to choose new files or Show Graphs to display the Network.
The graph representation of the Network is composed by nodes (circles) and interactions (arrows). If it is not uploaded any configuration file then the graph will have a circular layout by default and the node labels will be numbers from 1 to N, being N the number of nodes in the network. If uploaded a configuration file then the graph layout and the nodes labels will be the ones saved on the file. The following two images illustrate both this situations with and without configuration file, respectively:
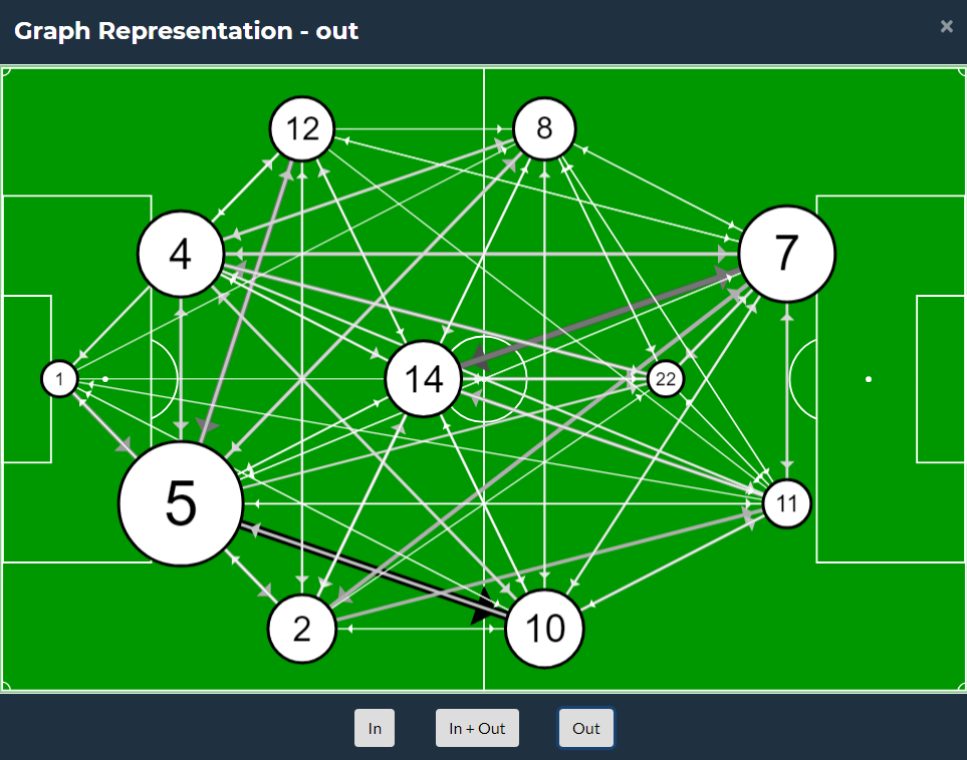
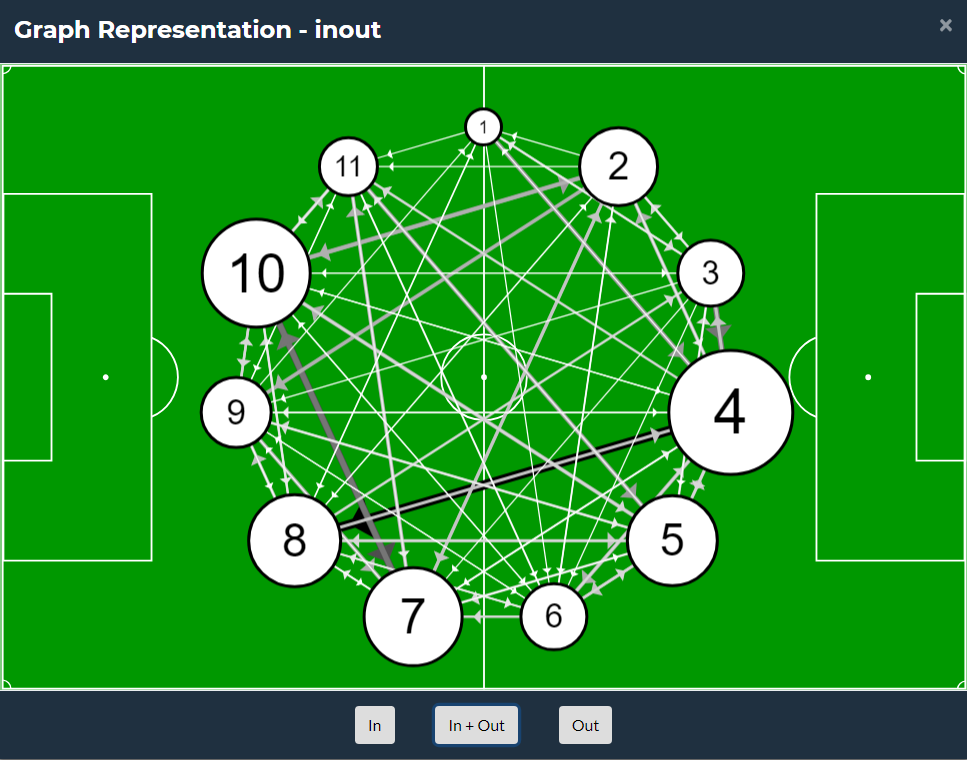
If the Network is a digraph then the arrows will illustrate both the interaction and the direction. The size and color gradient of each node and arrows indicate the importance inside the Network. In the case of Sports this can be related to the amount of passes each player make to or receive from all the other team players. This is what the 3 buttons in the bottom area of the window are used for. The In modifies the graph so it shows the amount of interactions a node receives from the other nodes. The Out shows the amount of interactions a node made to the other nodes. The In+Out sums the information from In and Out. As in an example: the title on top of the first image illustrated below is Graph Representation - out, and the node number 5 has the biggest circle meaning it is the one with the most interactions made, particularly to node 10 since the arrow is the biggest and darker one.
The system also gives a degree of freedom for the user to manipulate the nodes positions on the field by clicking on them once to select and clicking anywhere on the field again to move them. Also if the user double click on any node it will show just the interactions of that particular node. To show all the interactions again just double click on any empty spot of the field.
Calculate Metrics
To calculate metrics from a Network file go to Modules > Calculate Metrics. Here you can upload a Network file either created and downloaded from Create Network or from an external source. If uploaded a file from an external source then it is important to know that the file should have a specific format, explained on Help > Display Network. After selecting the Network file there is an option to also select a configuration file (not required). This file is automatically created when the Network is downloaded from Create Network and in this case it will be used to show the saved custom node labels on the calculated metrics results. Finally there is 3 lists of metrics to select: Individual, Network and Subgroup and one list to select what nodes should be used to calculate the metrics. After all selected, clicking on Calculate will make a metric calculation request to the system and automatically redirect the user to the Modules > Display Results page. The time the calculations will take depends on the amount of metrics and nodes selected as well as the size of the Network itself. If Receive notifications by e-mail is selected the user will receive an e-mail when the metrics calculation is finished.Display Metrics Results
To display the calculated metric results go to Modules > Display Results. This page is divided in two types of results (having two different buttons on the top of the page for it). Clicking on Metrics Results button will show a list of all the metrics calculation requests made by the user, illustrated on the following image: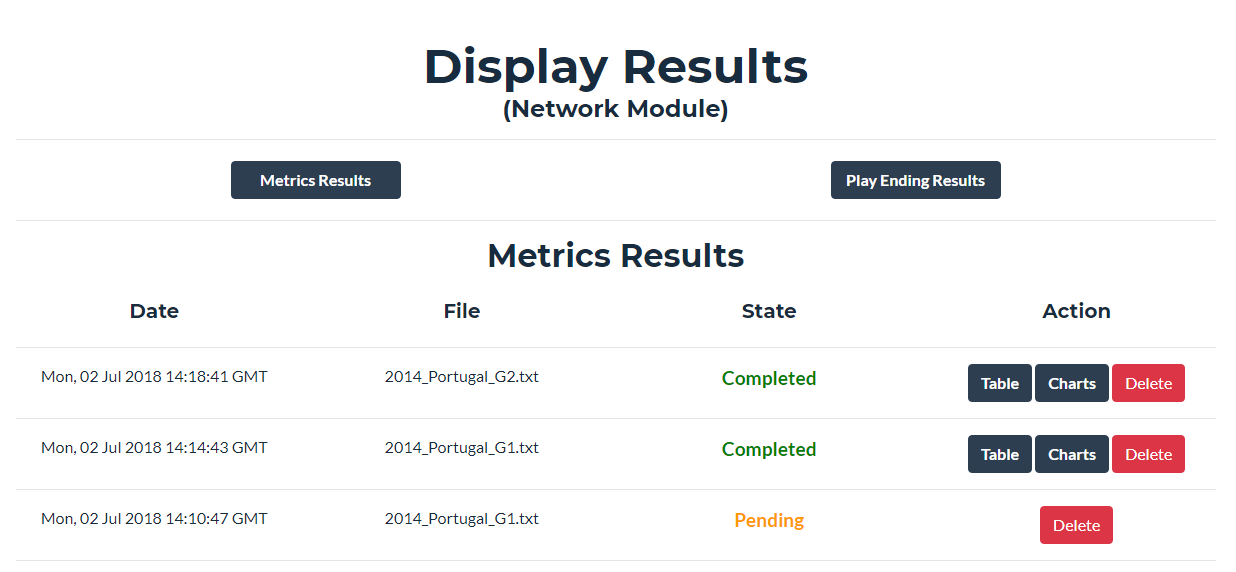
Date: The date when that metrics calculation was requested.
File: The name of the Network file uploaded.
State: The current state of the calculation. It can have 3 different states:
Completed, Pending or Failed.
Action: The possible actions to take: Show the results in a Table, in Charts or Delete the results.
File: The name of the Network file uploaded.
State: The current state of the calculation. It can have 3 different states:
Completed, Pending or Failed.
Action: The possible actions to take: Show the results in a Table, in Charts or Delete the results.
To display the metrics results for any calculation requested by the user just click on the Table button from the respective request. To download the results click on the download results button in the top right corner of the table.
Display Statistical Charts
To display the statistical charts from the calculated metrics go to Modules > Display Results. As it is explained on Help > Display Metrics Results just find the required result and click on the Charts button. Here you can select to either display the individual, subgroup or team metrics, the players, filter the values with or without normalization and select the type of chart. When all settings are chosen click on the Show Charts button.Display Play Ending Results
The Play Ending results are the information obtained of all the play endings in any game coded on Modules > Create Network. To display this results go to Modules > Display Results. This page is divided in two types of results (having two different buttons on the top of the page for it). Clicking on Play Ending Results button will show two fields to select different type of files: the Play Ending file and the Configuration file. These two files are obtained from downloading the created Network on Modules > Create Network. The Configuration file is optional as it is only used to display the players names on the charts.GPS Module
Insert Data: Location
To insert, edit or remove data for Location go to Modules > Sports and click on Location button. A location can be created by filling out the Name and then selecting one of the options for Dimension Type:- Length and Width - only require the length and width of the location.
- Corners' GPS Coordinates - requires the coordinates for each of the four corners of the location.
To submit a location click on Submit button. To edit or delete a location select one first and click on the Update or Delete buttons.
Insert Data: Team
To insert, edit or remove data for Team go to Modules > Sports and click on Team button. A team can be created by filling out the Name.To submit a team click on Submit button. To edit or delete a team select one first and click on the Update or Delete buttons.
Insert Data: Player
To insert, edit or remove data for Player go to Modules > Sports and click on Player button. A player can be created by filling out the Name, Number, selecting a Position (Defender, Midfielder, Forward or Other) and selecting a Team from the list.Note: Some of the metrics can only be calculated if the players have an associated Position (different than Other), such as the Team Formation, and others have extra results, such as the Principal Axes.
To submit a player click on Submit button. To edit or delete a player select one first and click on the Update or Delete buttons.
Insert Data: Game
To insert, edit or remove data for Game go to Modules > Sports and click on Game button. A game can be created by filling out the Name, selecting the Location where it took place, selecting a Team and inserting the Date and Time. This is good enough for practice matches or when you only have data for a team. In other cases, you can add a Second Team and, if applicable, a Jokers Team.To submit a game click on Submit button. To edit or delete a game select one first and click on the Update or Delete buttons.
Insert Data: Position
To insert, edit or remove data for Position go to Modules > Sports and click on Position button. The position data can come from multiple recognized formats, some of which are Individual (only contain data for a single player) or Multiple (contain data for multiple players). Deppending on the type of file you have, you should select the appropriate sub menu by clicking on the Individual Data or Multiple Data buttons.For Individual Data, to submit position data select the Player whose data you're inserting, select the File, select the file Format and then select one or multiple Games. Selecting multiple games, allows you to split the data of a single file into multiple games. The recognized file formats for Individual Data are:
- "FieldWiz" if the file you have was downloaded from the FieldWiz system.
- "Template" if you copied your data into the template available in the website or application and generated the csv file.
- "GPS Data (.gpx)" if you have a .gpx file with coordinates of the positions.
For Multiple Data, to submit position data select the Game and Team whose data you're inserting, select the File, and then select the file Format. The recognized file formats for Multiple Data are "Befica Lab", "Johan" and "Traxports" (see Help > GPS File Formats).
To submit a position data click on Submit button. To delete position data select the Game and click on the Delete button.
Calculate Metrics (Sports)
To calculate metrics (Sports) go to Modules > Sports and click on Calculate metrics button. To start, select a Game, fill out the Begin and End times for the interval of time you want to analyze, select the Field (this will be used when generating the images provided with the results) and select the Metrics and Players you want to be considered. When you select a game, the begin and end times are automatically filled with the beginning of the game, make sure to change the intervals to suit your needs. Another important feature worth mention is the Calculate for sub-intervals option, which allows you to request the calculation of the selected metrics for sub-intervals of the main interval you selected. These sub-intervals can either be Regular (each sub-interval has the same duration) or Irregular (each sub-interval has a different duration). Select the appropriate type of sub-interval and fill out the remaining fields.Note: Selecting a metric in the list does not mean it is going to be calculated. Each metric has different requirements, with some requiring fields to be filed in Advanced Parameters and others requiring you to previously set the player's positions. If at least one of the requirements fails, the metric is then skipped.
Note: The selected players only influence the individual and subgroup metrics. Team metrics will use the data from all available players. If you want team metrics to be calculated excluding some of the players, delete their data before calculating.
Note: The advanced parameters includes multiple default values for some parameters that will be used in the calculation of certain metrics. You can check these or even change them to insure complete control over the results.
Finally to send the request to calculate the metrics click on Calculate Metrics at the end of the page. After requesting the calculation of metrics, you'll be automatically redirected to the Modules > Display Results (GPS).
Calculate Metrics (General)
To calculate metrics (General) go to Modules > General. This works similarly to Help > Calculate Metrics (Sports), with the main differences being that you select a file, instead of a game, and that it only allows for the calculation of individual metrics.Display Metrics Results
To display the calculated metric results for GPS go to Modules > Display Results (GPS). This will show a list of all the metrics calculation requests made by the user, illustrated on the following image: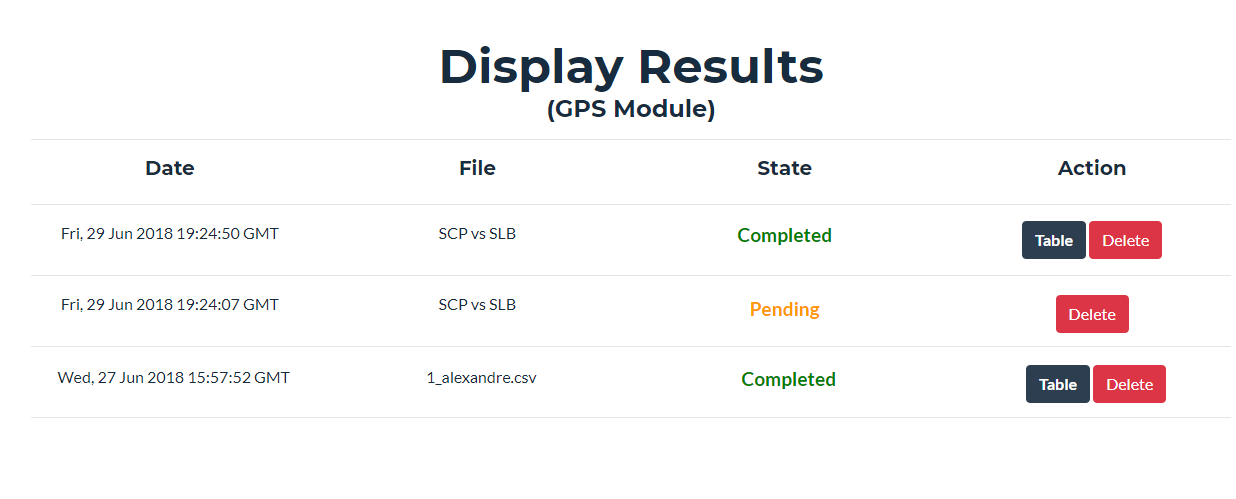
Date: The date when that metrics calculation was requested.
File: The name of the file uploaded or created by the system.
State: The current state of the calculation. It can have 3 different states:
Completed, Pending or Failed.
Action: The possible actions to take: Show the results in a Table or Delete the results.
File: The name of the file uploaded or created by the system.
State: The current state of the calculation. It can have 3 different states:
Completed, Pending or Failed.
Action: The possible actions to take: Show the results in a Table or Delete the results.
To display the metrics results for any calculation requested by the user just click on the Table button from the respective request. To download the results click on the download results button in the top right corner of the table.
GPS File Formats
Template: Built in the .ods format, which stands for OpenDocument Spreadsheet. It can be opened in most spreadsheet applications, including Microsoft Office's Excell, Libreoffice's Calc, among other. The template is made of five main columns, and two auxiliary. The main columns include:- The time is the time at which the data in the row was collected.
- The xPos is the position in the x-axis (length) inside a given perimeter (rectangle).
- The yPos is the position in the y-axis (width) inside a given perimeter (rectangle).
- The Latitude is the latitude of the object.
- The Longitude is the longitude of the object.
- The date is the date of the start of the collection (in the format YYYY-MM-DD HH:mm:ss).
- The frequency is the frequency (number of samples per second) of collection of data that your GPS device uses.
Note: When inserting GPS data (only latitude and longitude), the associated location needs to contain the coordinates for each of its corners (Corners' GPS Coordinates).
GPS Data (.gpx): The .gpx format stands for GPS Exchange Format, and it is the most common format used for storing GPS data. The user should be able to use most .gpx files in uPATO, the only restrictions are that each data point is called "trkpt", containing the attributes latitude and longitude and a tag with the time. If for some reason the user's file does not comply with this requirements, the user can always copy the latitude and longitude to the Template and submit as such.
Note: When inserting GPS data, the associated location needs to contain the coordinates for each of its corners (Corners' GPS Coordinates).
Traxports: The traxports files requires a special configuration for it to be used in uPATO. This configuration is performed as follows: inside the traxports system, to start the registration, select a player and click the "Add Note" button and write "start-#player_name", where #player_name should be replaced with the name of the player that was previously registered; to end the registration add a note with "stop-#player_name". After exporting the file, it should be ready to be used by uPATO.